
When Should You Use the Demand Forecasting Report?
Use this report when you want to:
Estimate how much stock you will need in the next period
Identify products that are likely to stock out soon
Compare current inventory against expected future demand
Support purchasing and replenishment decisions with data
How to Create a Demand Forecasting Report
Step 1: In your OSL Dashboard, click the ‘Create New Report’ button.

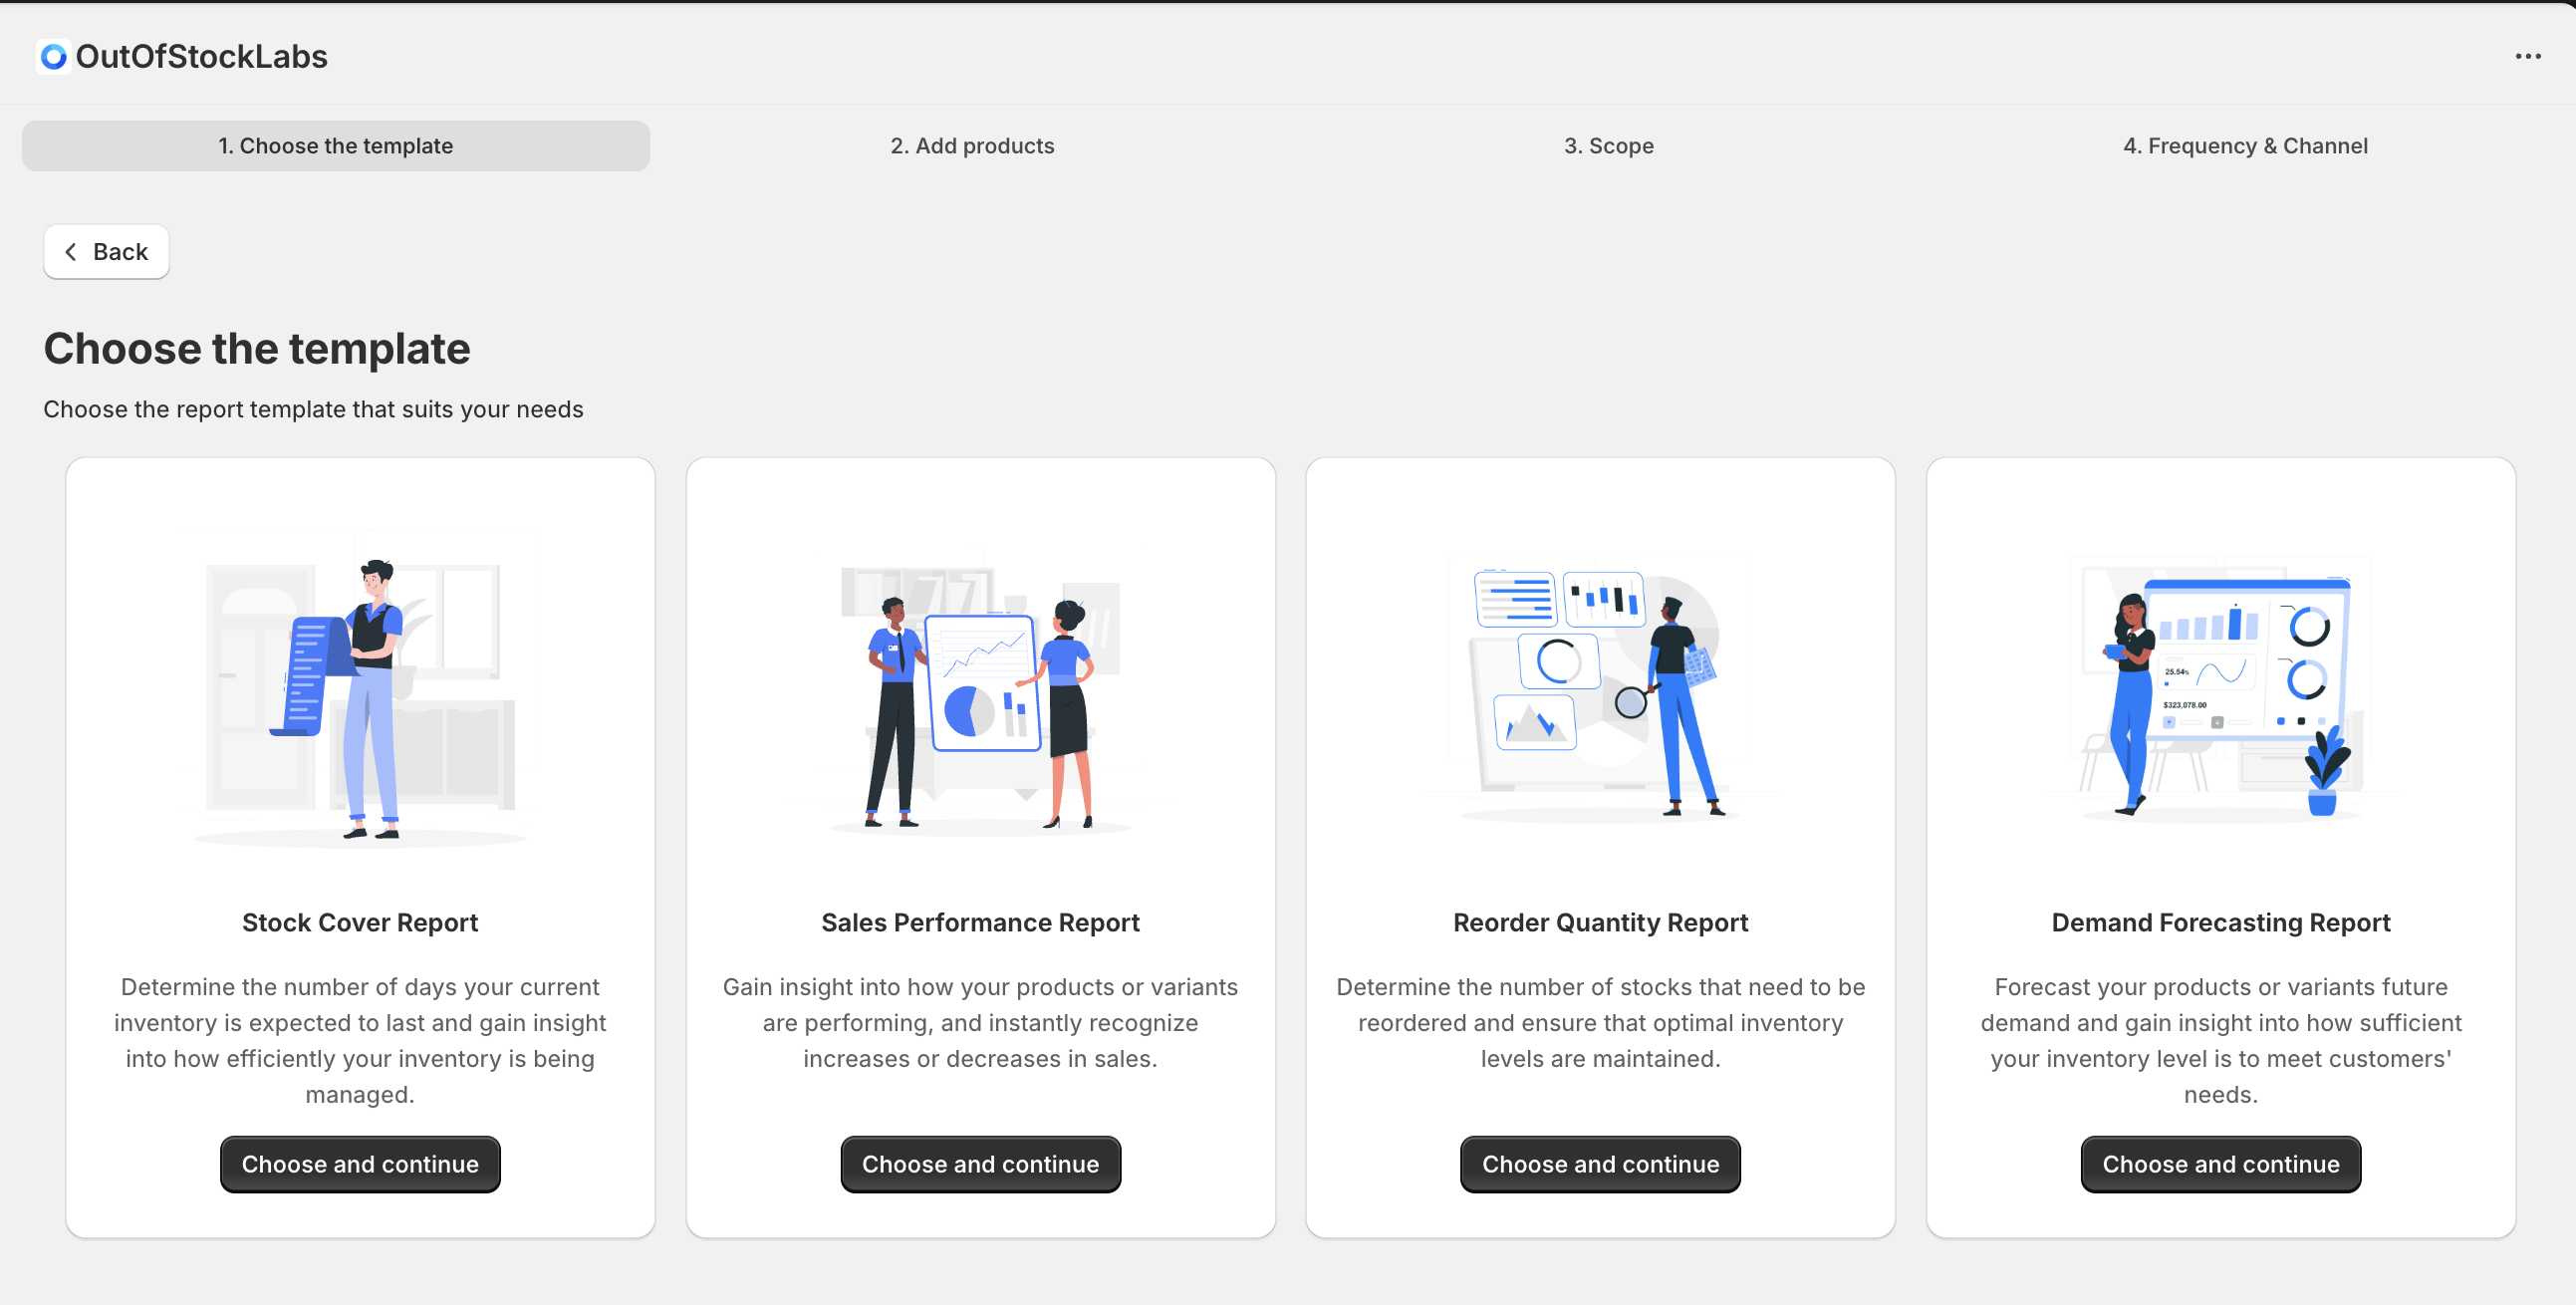
Step 2: Select 'Demand Forecasting Report,' then click 'Choose and Continue.’
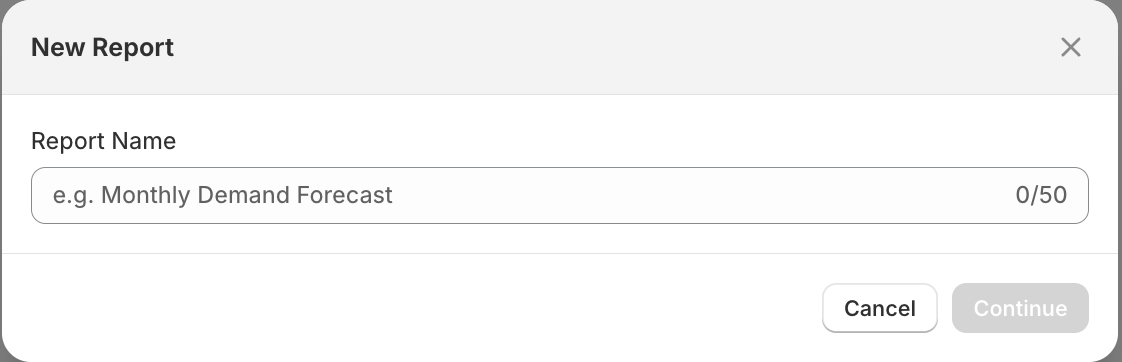
Step 3: Enter a name for your report and select the time period. Click 'Continue' when you're ready.
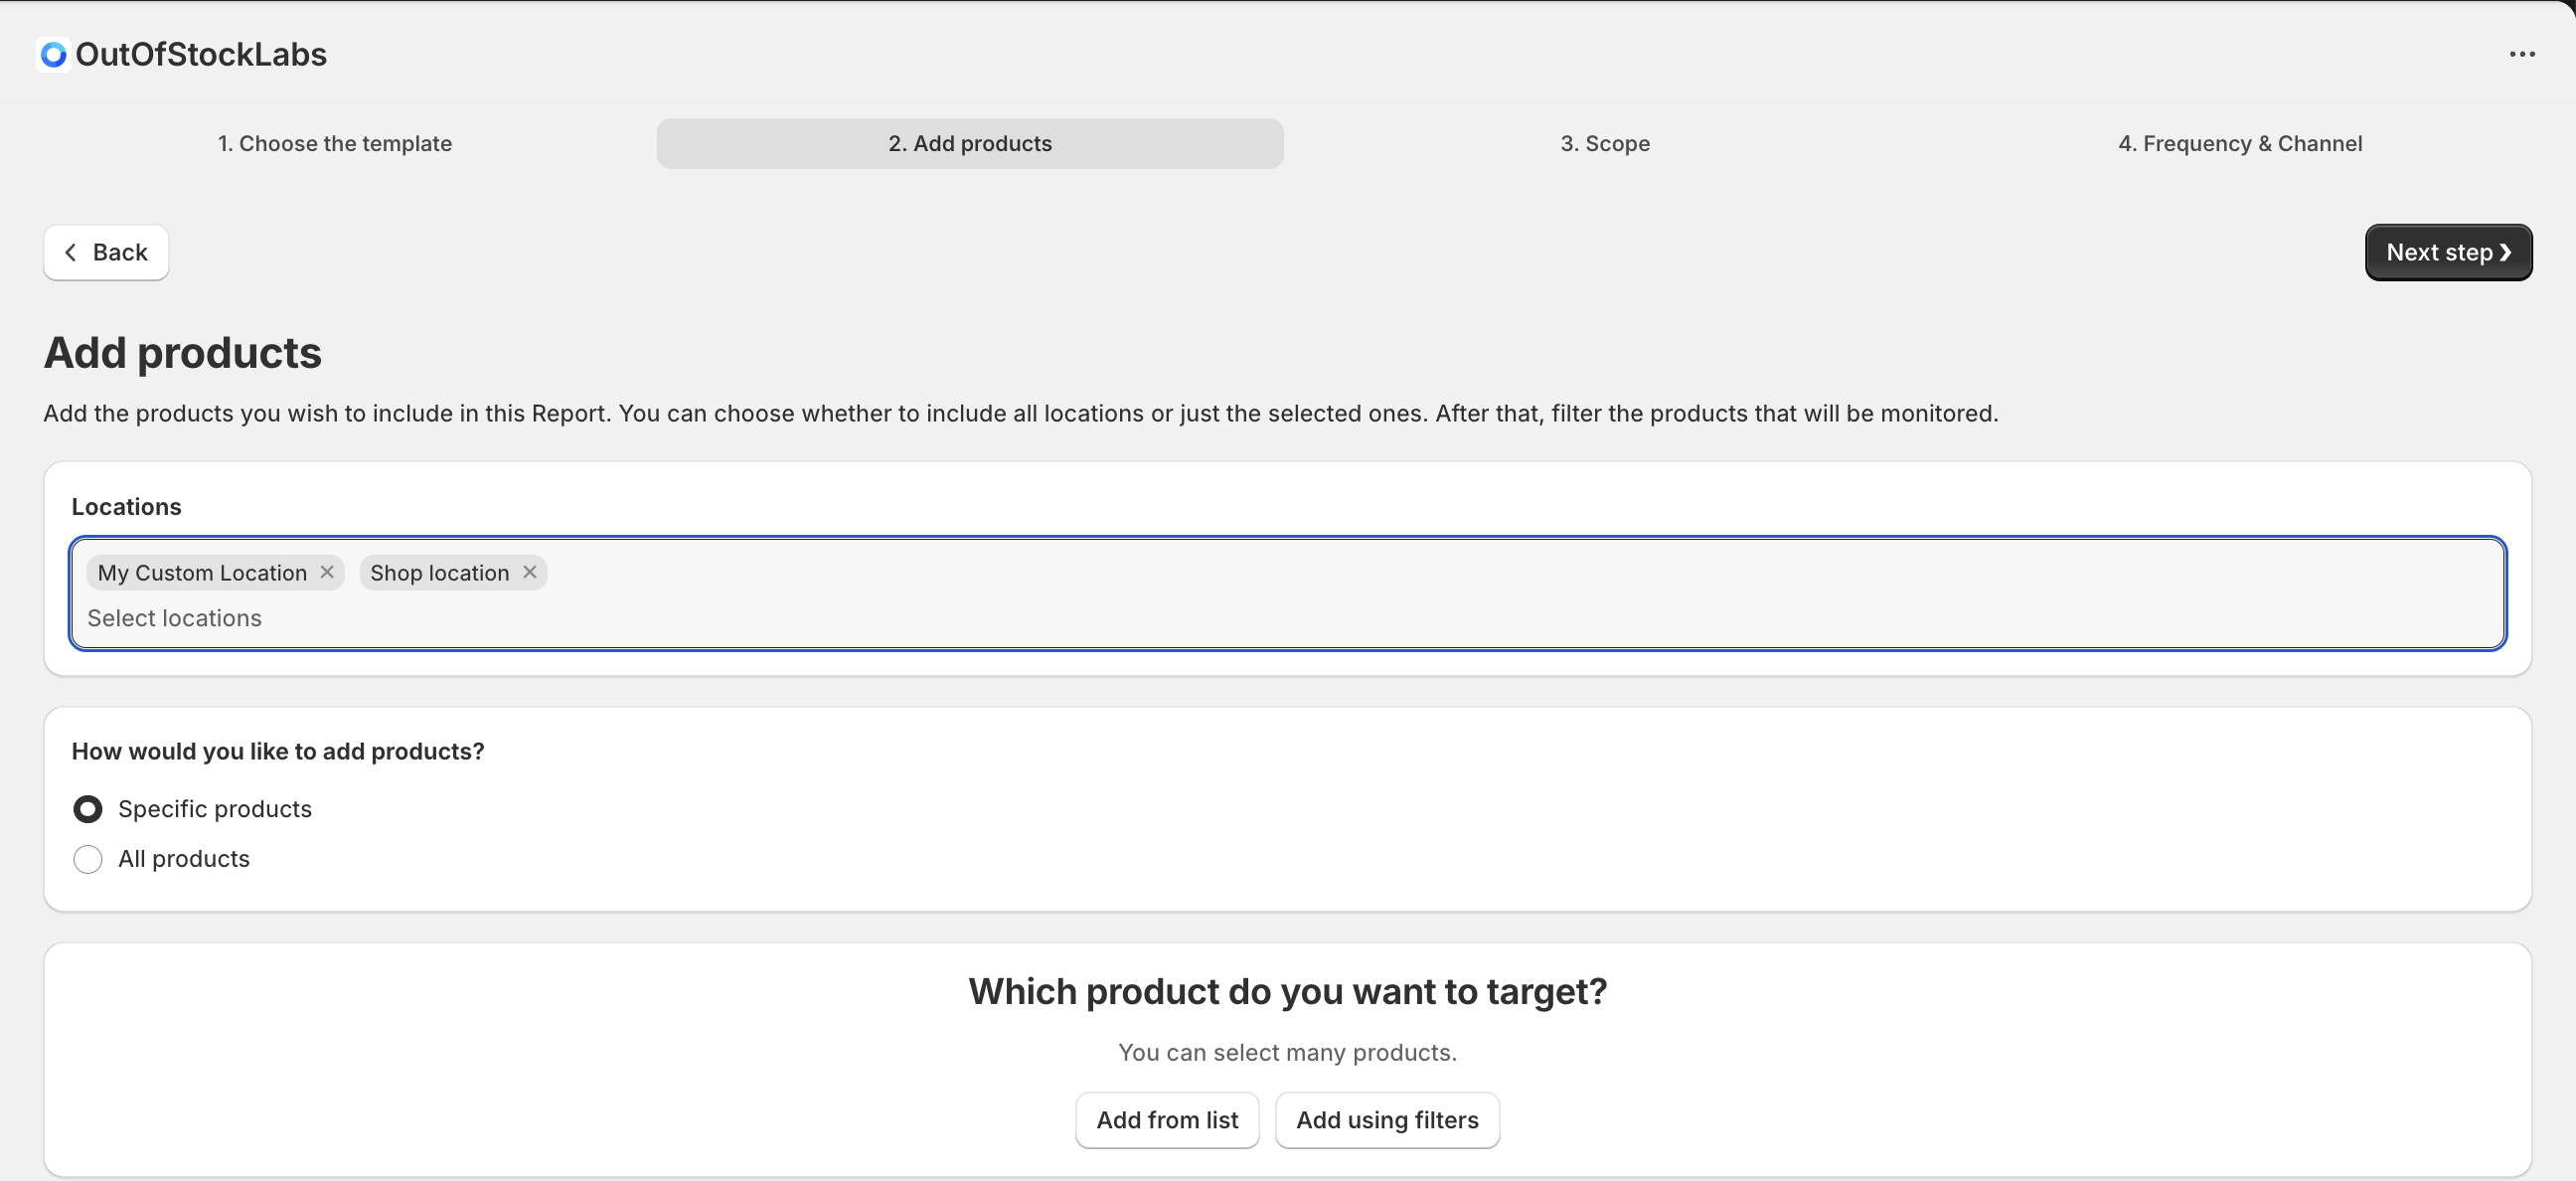
Step 4: Select a location, then add products. Once the products are added, click the ‘Next Step’ button.
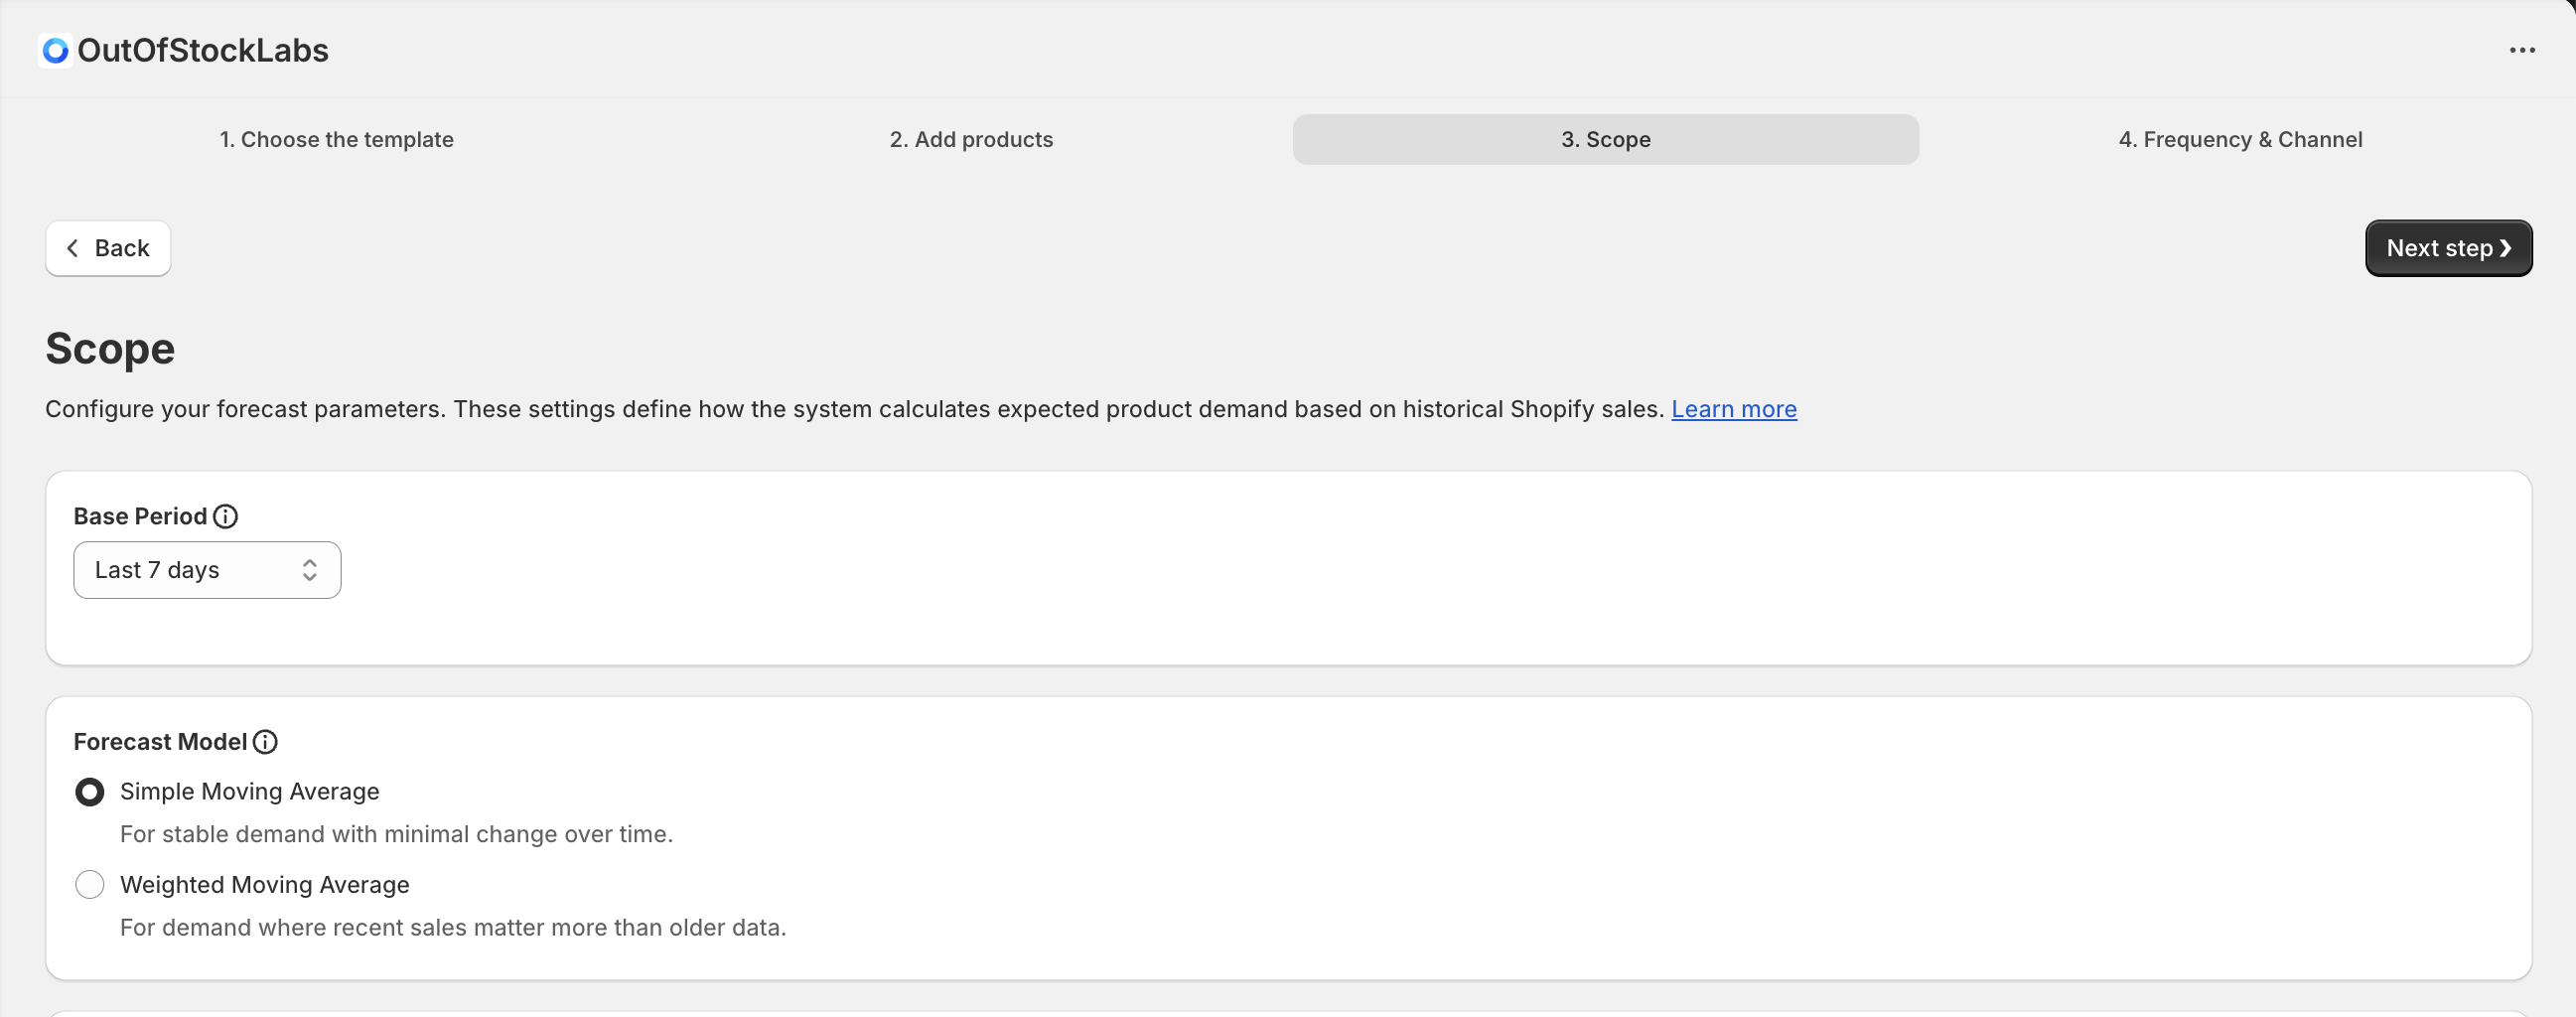
Step 5: Configure the Scope
→ Choose a Base Period
The Base Period defines how much historical data is used to calculate the forecast.
Available Base Period options:
Last 7 Days
Last 14 Days
Last 30 Days
Last 60 Days
Year-to-Date (YTD)
Custom
Only completed periods are included in the calculation.
→ Select a Forecast Model
Choose one of the following forecast models:
Simple Moving Average (SMA) – treats all historical periods equally
Weighted Moving Average (WMA) – gives more importance to recent demand
The system controls all calculation logic. You only select the model and Base Period.
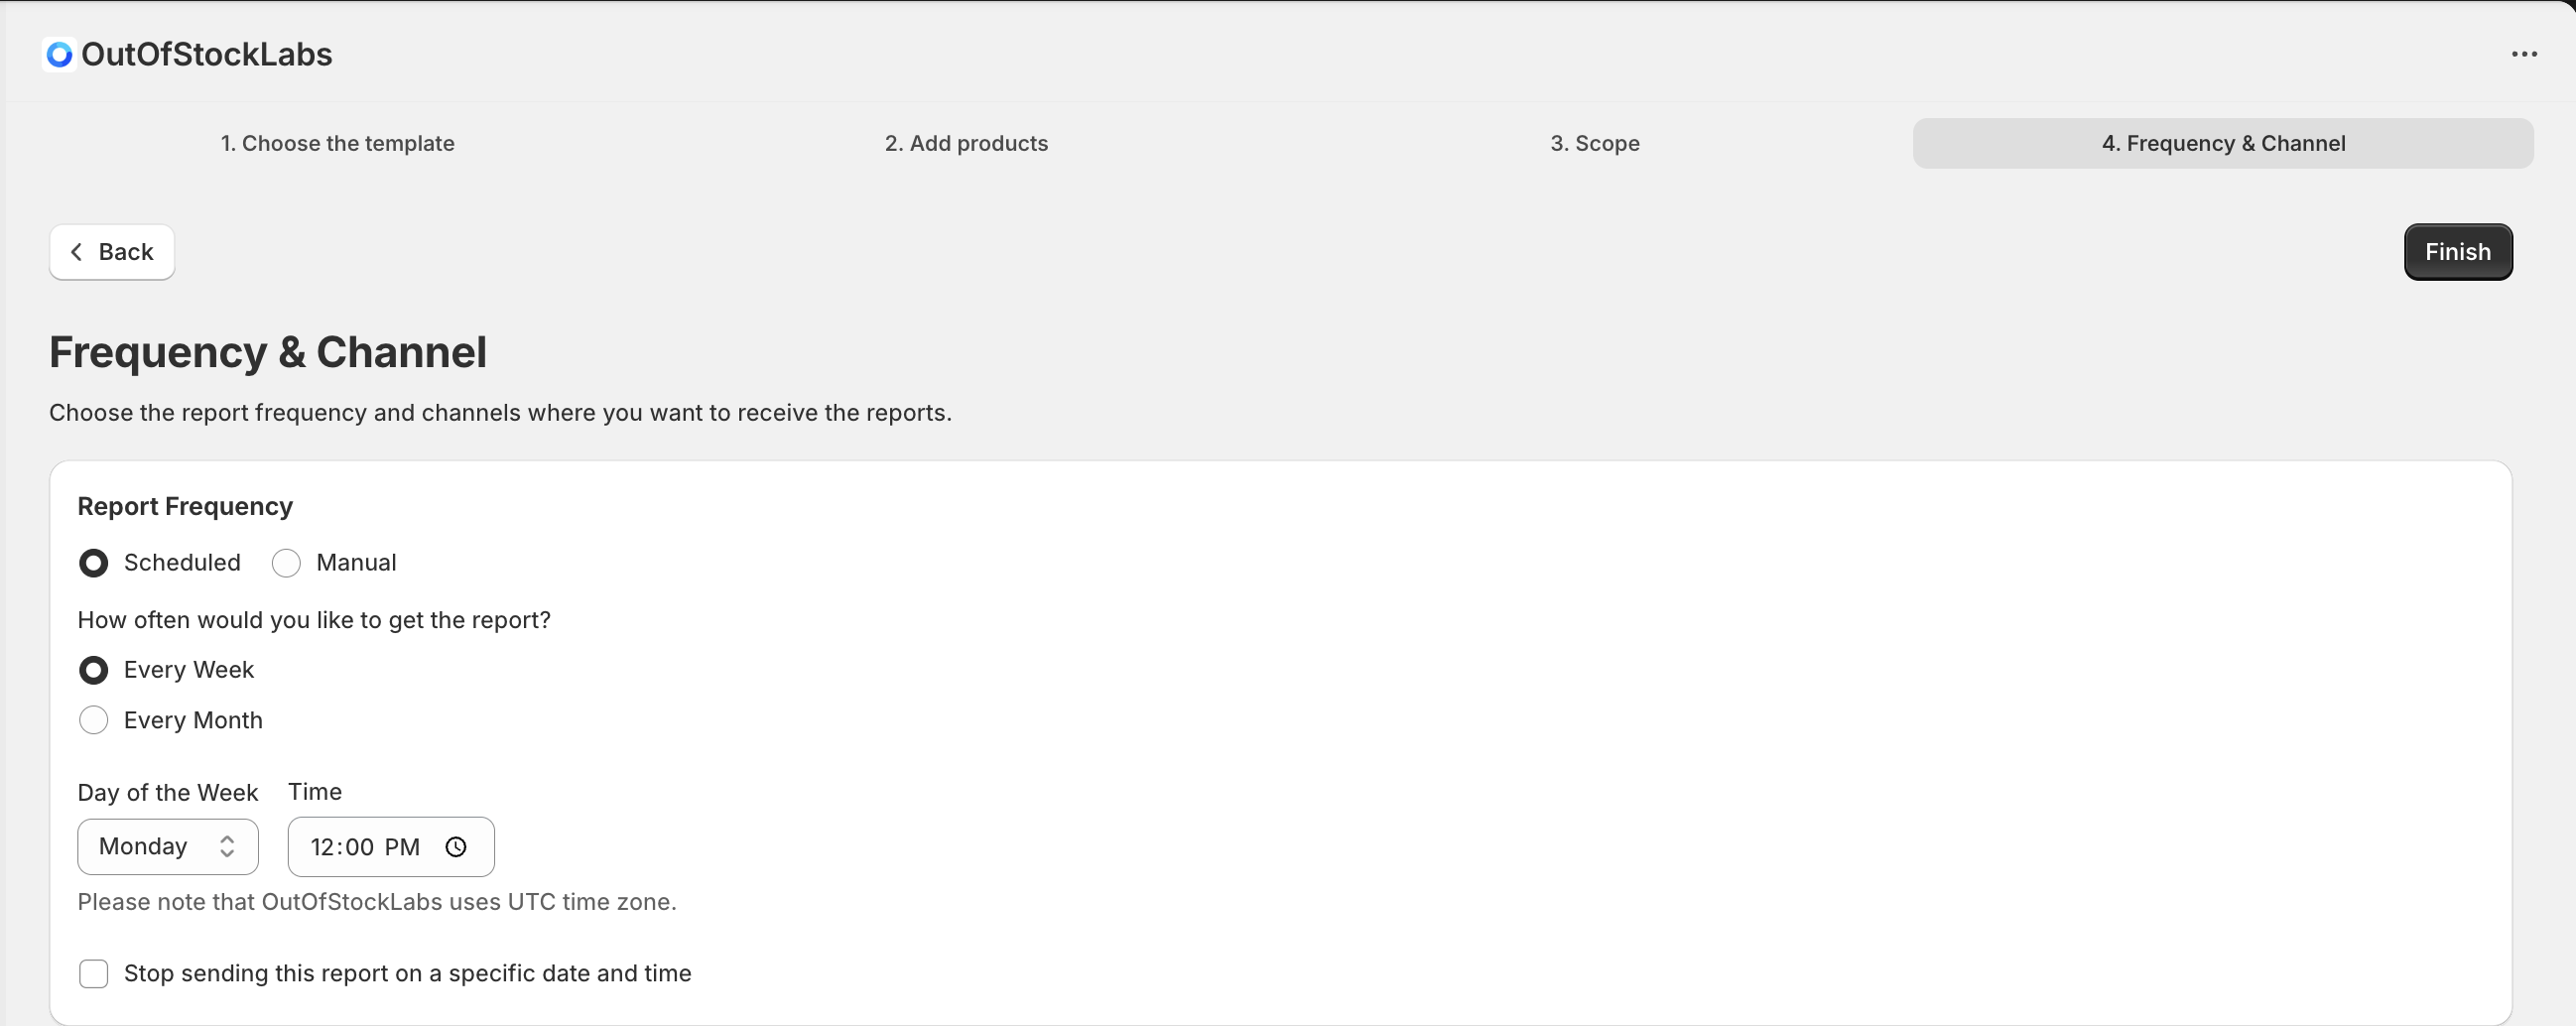
Step 6: Select Report Frequency and Delivery Channels
Choose how often you want to receive the Demand Forecasting Report and where it should be delivered
📌 This step is optional if you only want to generate the report manually, but required for scheduled reports.
Frequency & Channel Settings
Report Frequency
You can choose between:
Scheduled – The report is automatically generated and sent on a recurring basis
Manual – The report is generated only when you run it manually
Scheduled Report Options
When Scheduled is selected, configure the following:
How often would you like to get the report?
Every Week
Every Month
Day of the Week
Select the day the report should be sent (e.g. Monday).
Time
Choose the time the report will be delivered.
⏰ Please note: OutOfStockLabs uses the UTC time zone for all scheduled reports.
Optional Settings
Stop sending this report on a specific date and time
Set an end date if you want the schedule to automatically stop.
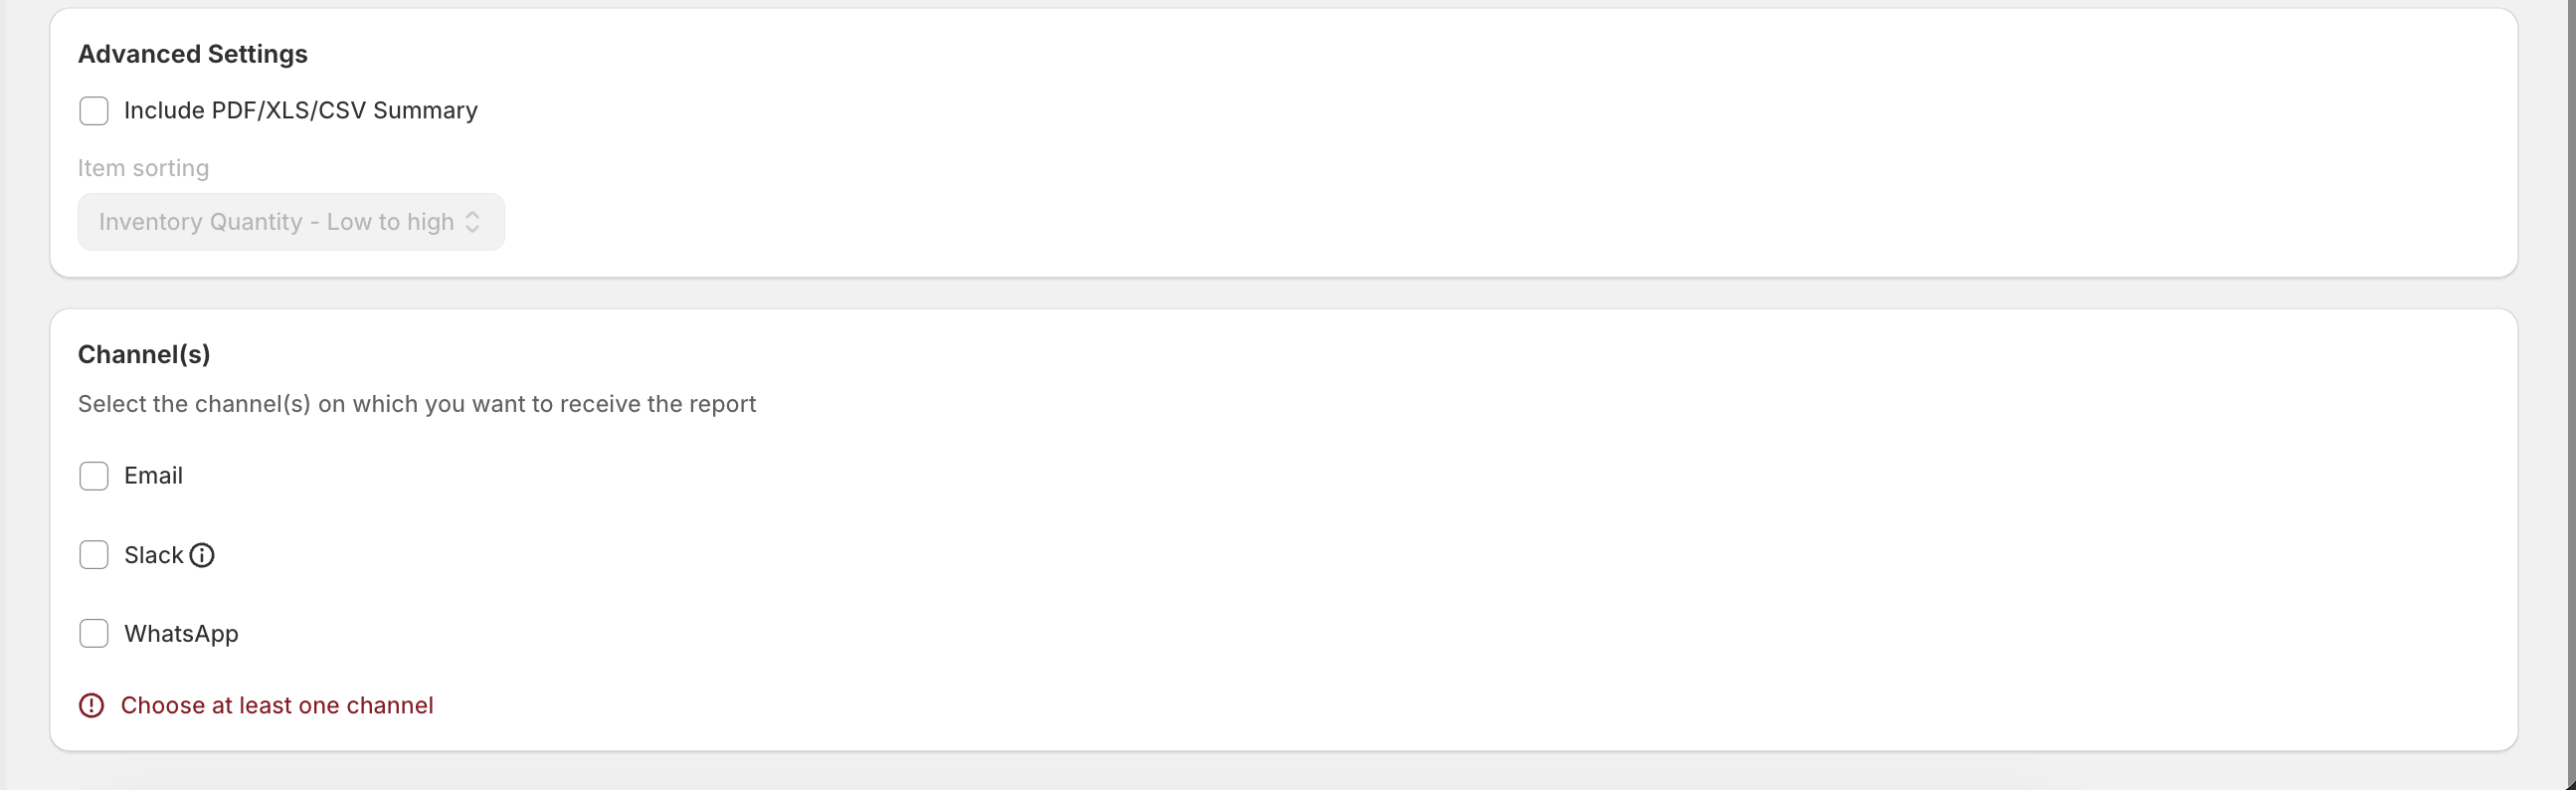
Advanced Settings
Include PDF / XLS / CSV summary
Item sorting (e.g. Inventory Quantity – Low to high)
Delivery Channels
Select where you want to receive the report. You must choose at least one channel.
Available channels:
Email
Slack
WhatsApp
Step 7: Finish and Save
Once all settings are complete, click Finish to save your report configuration. Scheduled reports will be sent automatically based on your selected frequency, while manual reports can be generated anytime.
Understanding the Report Header
The report header provides context for how the data was generated:
Left side:
Report Name
Report Type
Selected Locations
Base Period
Forecast Model (SMA or WMA)
Right side:
Standard report controls (same as other reports)
Report Columns Explained
Product Name – Name of the product
Collections – Associated product collections
SKU – Stock Keeping Unit
Tags – Product tags
Available Inventory – Current available stock
Forecasted Demand – Predicted demand for the next period
Forecasted Stock Coverage – Available Inventory ÷ Forecasted Demand
Predicted Future Stockout Date – Current Date + Forecasted Stock Coverage
Frequently Asked Questions
Why can’t I edit the formula or weights?
To ensure consistency and accuracy, all calculation logic is standardized across the system.
Why does my forecast change each day?
As new completed days become available, the historical data used for forecasting updates whenever you generate a new report.