CHOOSING THE TEMPLATE
Step 1. In your OSL Dashboard, click the ‘Create New Report’ button.

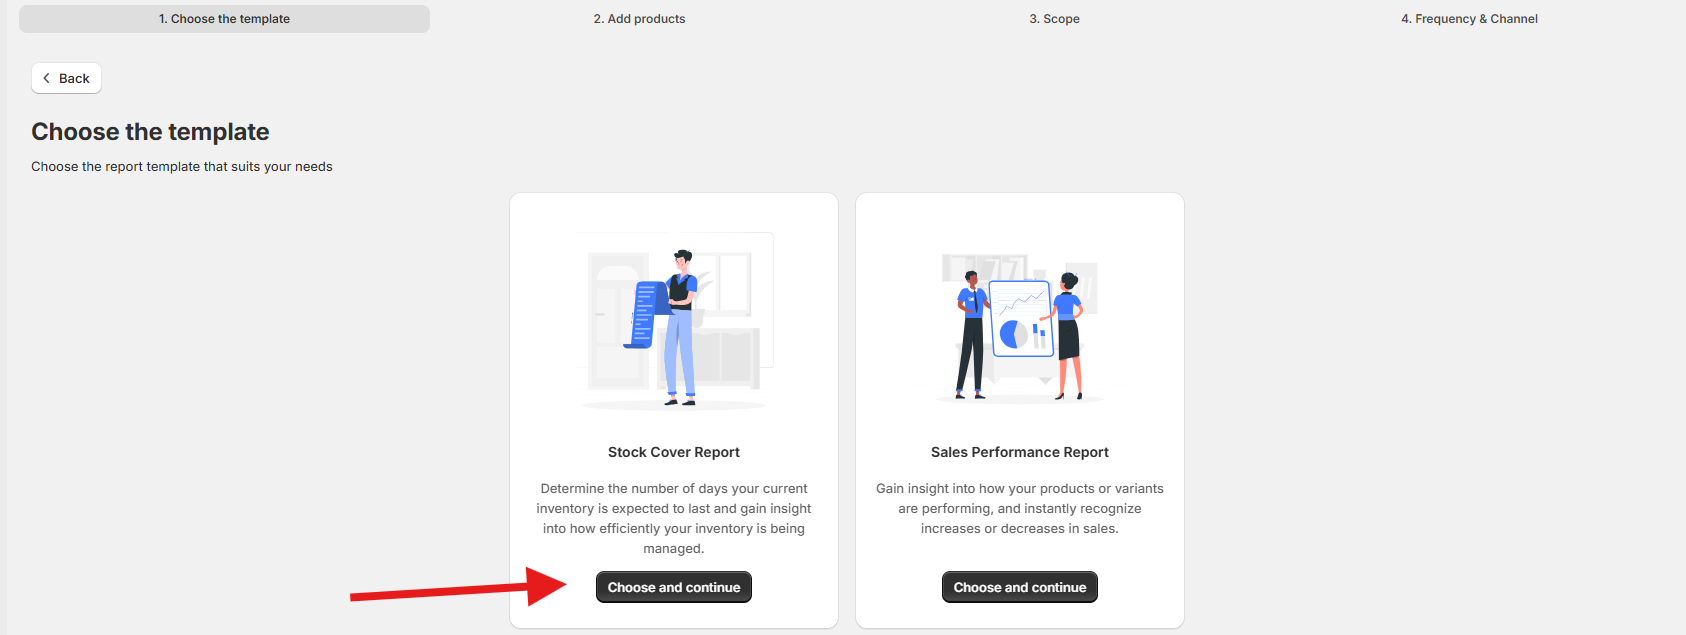
Step 2: Select ‘Stock Cover Report’
From the list of available report types, select Stock Cover Report and click Choose and Continue.
This step ensures you are generating the correct report focused on product and variant performance. The Stock Cover Report provides you valuable insight into how efficiently your stock is being managed. Use this report to anticipate restocking needs, avoid stockouts, and maintain a smooth inventory flow across your store locations.
👉 By selecting this report type, you’ll gain a clear understanding of your stock longevity and efficiency. The Stock Cover Report shows how many days your current inventory is expected to last, helping you plan restocks and manage inventory more effectively.
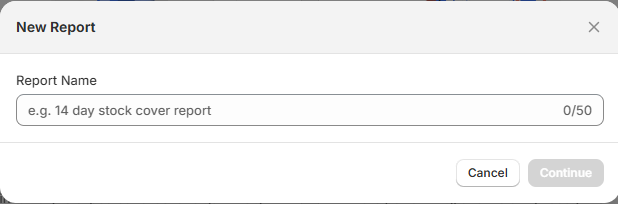
Step 3: Enter a Report Name
In this step, you will define the basic detail for your Stock Cover Report:
Report Name – Give your report a clear and descriptive name. This helps you identify and manage reports later. You can use alphanumeric and special characters, up to a maximum of 50 characters.
👉 This step ensures your report is easy to identify.
ADD PRODUCTS
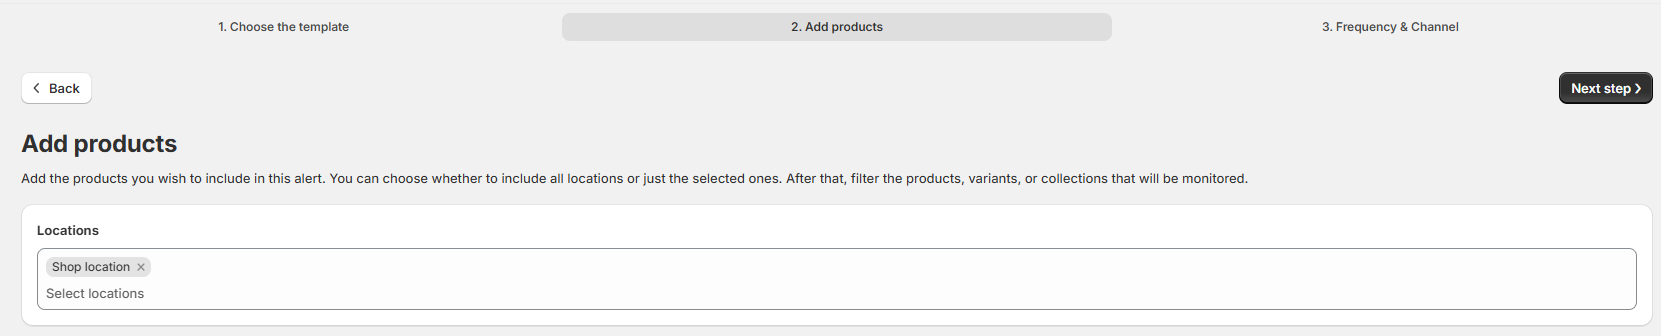
Step 4: Select Location
In this step, you will choose the store location from which you want to pull product data. This ensures that the Sales Performance Report reflects inventory and sales specific to that location.
Once a location is selected, you can add the products you want to include in the report. The system will automatically filter and display products based on the chosen location, making it easier to manage if you have multiple stores or a large product catalog.
This step is especially useful for Shopify admins, owners, or users managing several products across different locations, as it helps narrow down the selection to only what’s relevant.
Step 5: Add Products
In this step, you’ll decide which products to include in your Sales Performance Report. You can either add All Products or choose Specific Products.
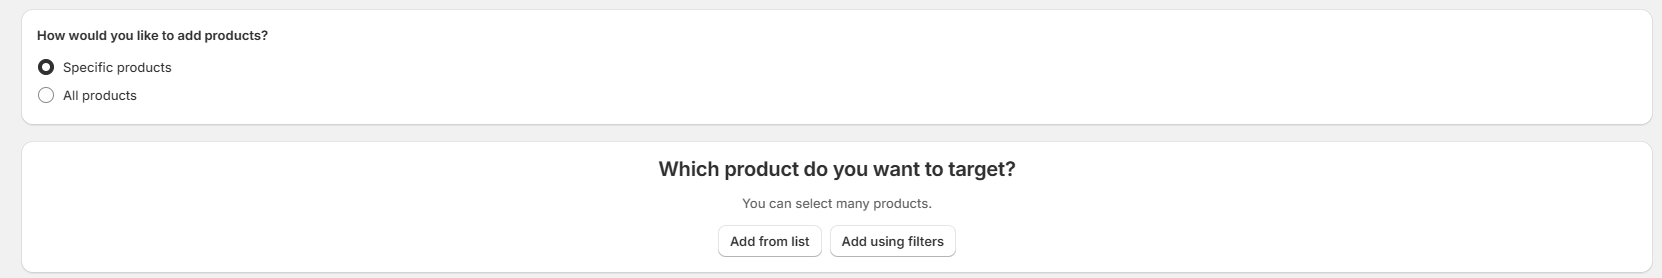
Option 1: Add Specific Products
You can add specific products in two ways: Add From List or Add Using Filters.
A. Add from List
Select Specific Products → Add from List.
A modal will open showing all products available in your selected location.
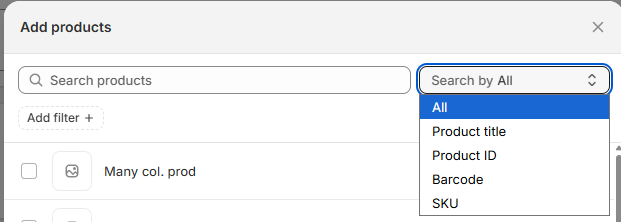
Use the search bar to find products by (By default, search runs across all fields.):
Product Title
Product ID
Barcode
SKU
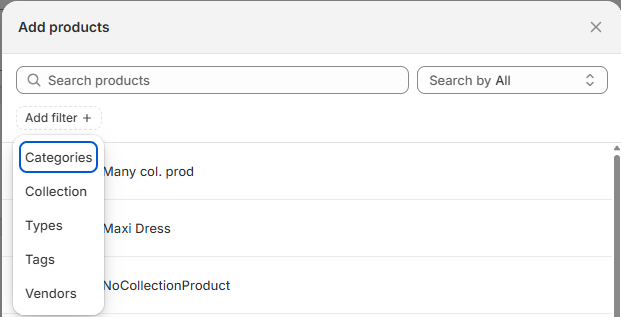
Use the filters panel to narrow down the list by:
Category
Collection
Product Type
Tags
Vendor
Select one or more products from the list.
Click Add to confirm your selection.
B. Add Using Filters
Select Specific Products → Add using Filters.
Define your filters using Attribute – Condition – Value format.
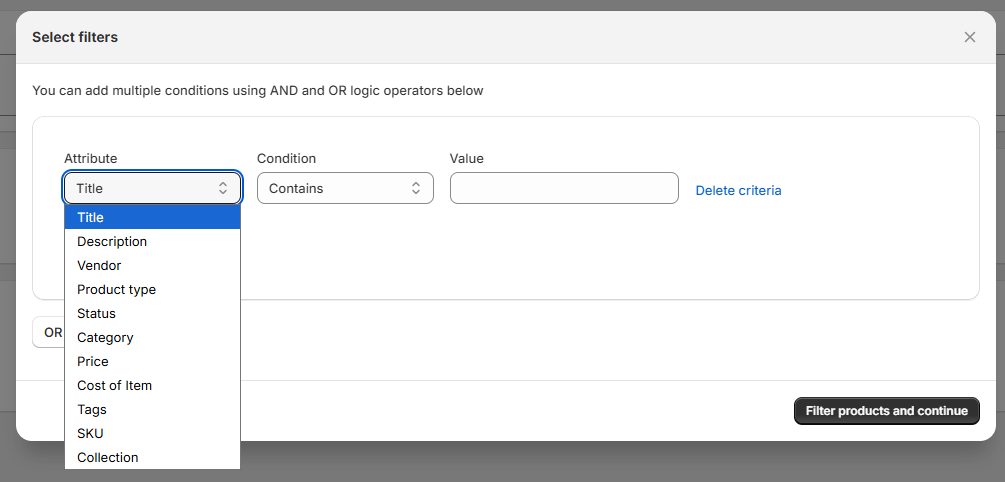
Examples:
Title → Contains → “T-shirt”
Vendor → Is → “Nike”
Price → Greater than → 100
Cost of Item → Between → 20 and 50
SKU → Doesn’t contain → “TEST”
→ You can set up multiple conditions and choose whether they should be applied with AND or OR logic.
→ Once your filters are set, the system will automatically pull all products that match your conditions.
Option 2: Add All Products
Select All Products.
All items from your chosen location will automatically be included in the report.
Use this option if you want to analyze your entire product catalog without filtering.
✅ Tips:
Choose All Products if you want a broad overview of sales performance across your store.
Choose Specific Products if you need a focused report on certain items, categories, or conditions.
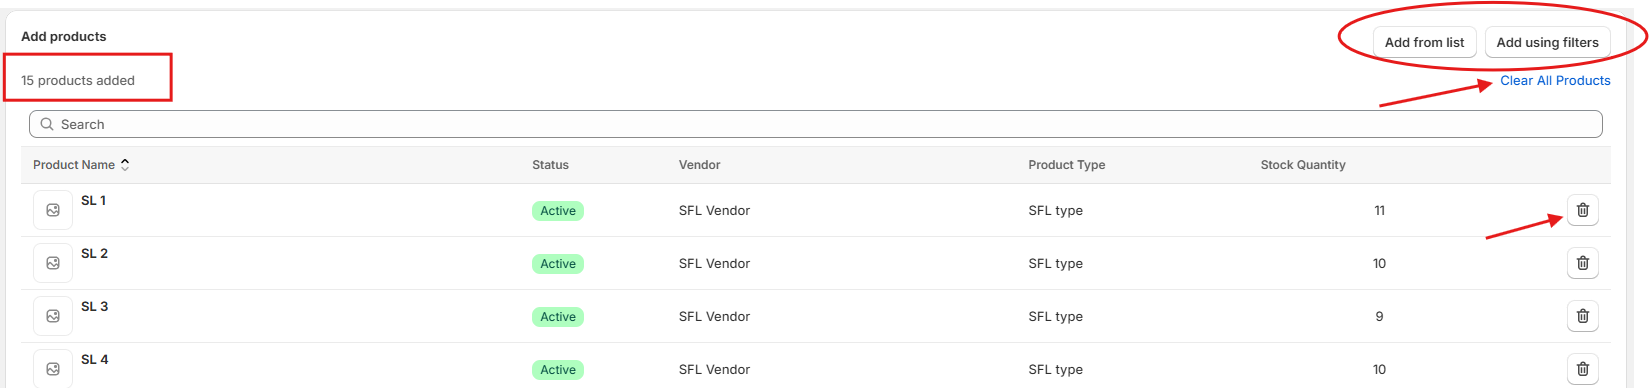
Once you’ve finished selecting products, you can review them in the table displayed at the bottom of the page. This table includes key details such as Product Name, Status, Vendor, Product Type, and Stock Quantity.
If you need to make adjustments, you can:
Remove individual products by clicking the trash icon on the right-side.
Use Clear All Products to reset the list and remove all selected items at once.
Add option buttons will be located at the upper-right side of the table list.
Once done with Location and Product Selection, click Next Step.

SCOPE
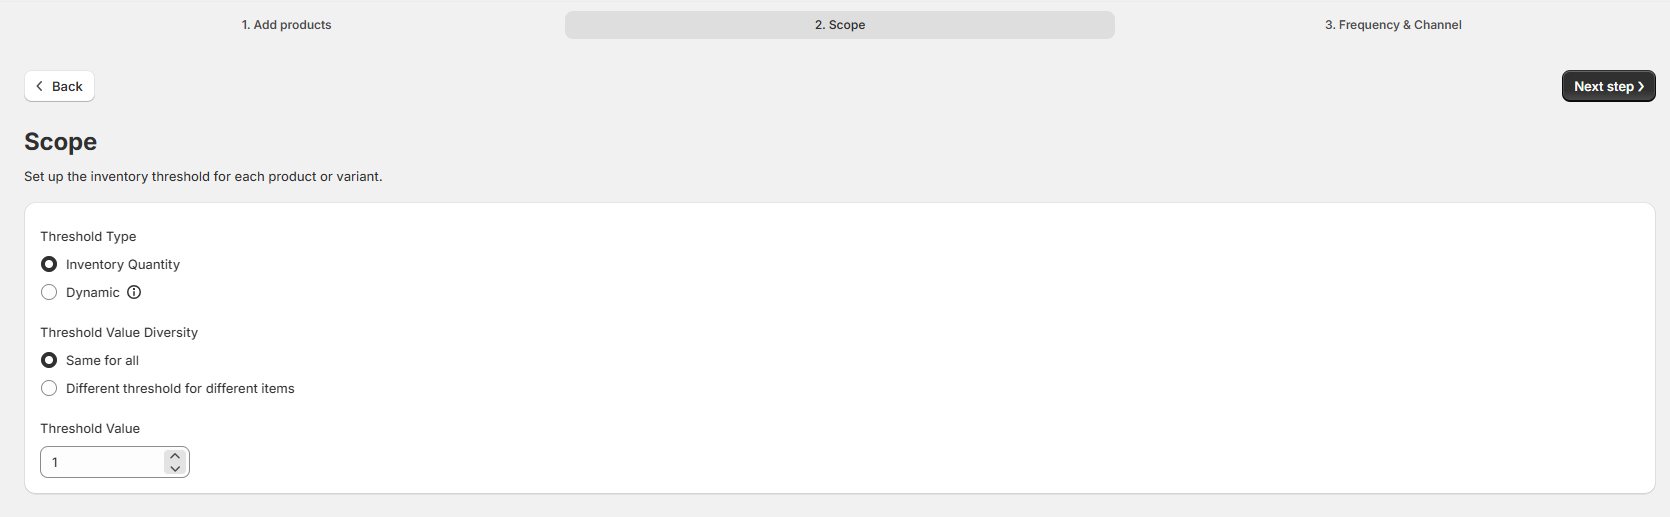
Step 6: Define the Scope
In this step, you’ll decide how thresholds are applied in your Stock Cover Report.
Tip:
Thresholds act as a safety buffer to help you plan restocks ahead and prevent unexpected stockouts.
1. Choose a Threshold Type:
Manual (Inventory Quantity) – Set a specific buffer (threshold value) for your products to calculate how many days your inventory can last before reaching your set limit. When this option is selected, the system uses Average Daily Sales calculated from the last 7 days by default to determine stock coverage.
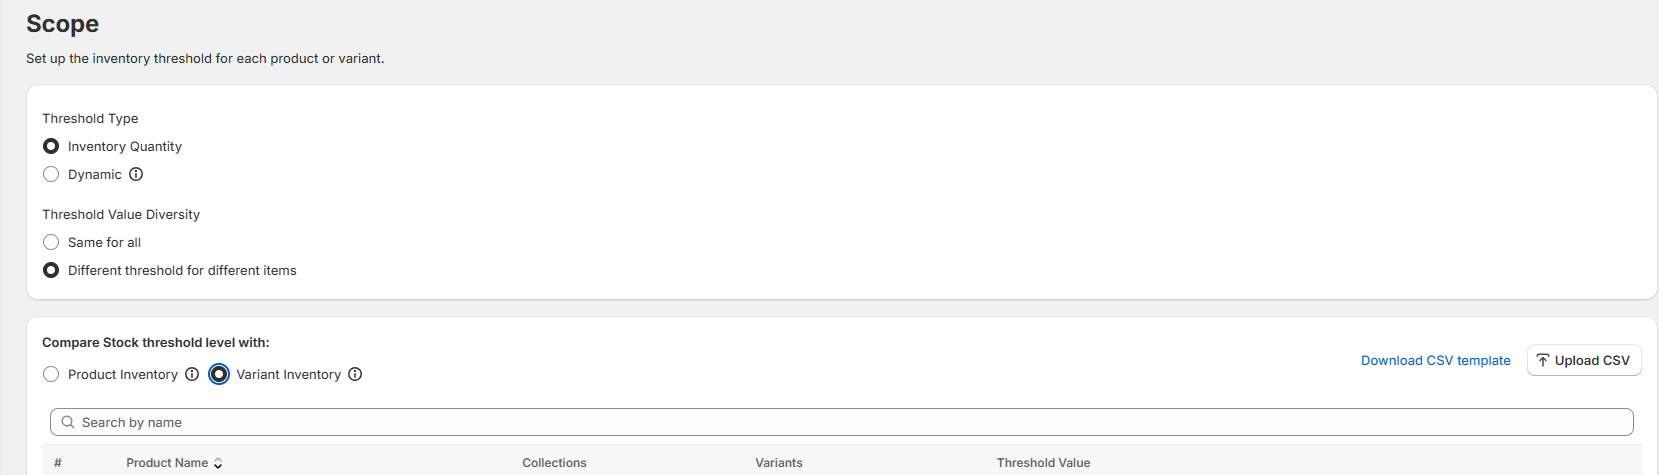
You can choose to:Same for all – Selecting this option means your set threshold value will be applied to all selected products, including variants.
Different threshold for different items – Selecting this option allows you to manually set a threshold for each product or variant for greater accuracy. You can also download a templated CSV containing all selected products, conveniently enter threshold values for each product or variant, and then upload the file to apply those values automatically.
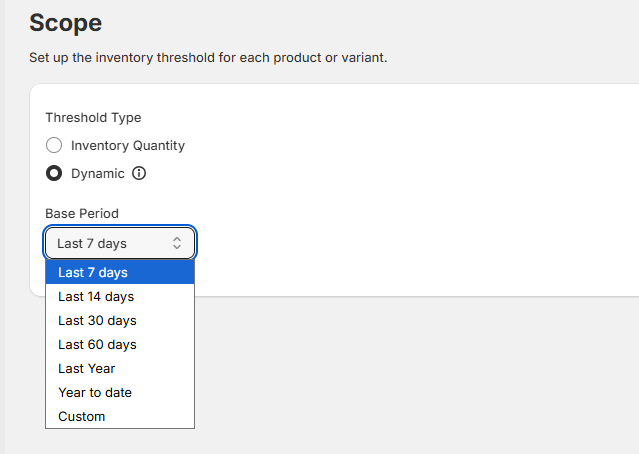
Dynamic – The system automatically calculates thresholds based on each product’s historical average daily sales depending on the base period you select.
Base Period – Choose the range of sales data you want to include. The selected base period determines which transactions will be analyzed. For example, if you select Last 7 Days, the system will generate a report of average daily sales from the last 7 days.
📌 Important Note:
If you select a custom period, the report will be static, meaning, it will always reflect only the data within that exact date range you set. Other options are dynamic—they automatically update and calculate relative to the current date when the report is generated.
Once done with the Scope, click Next Step.

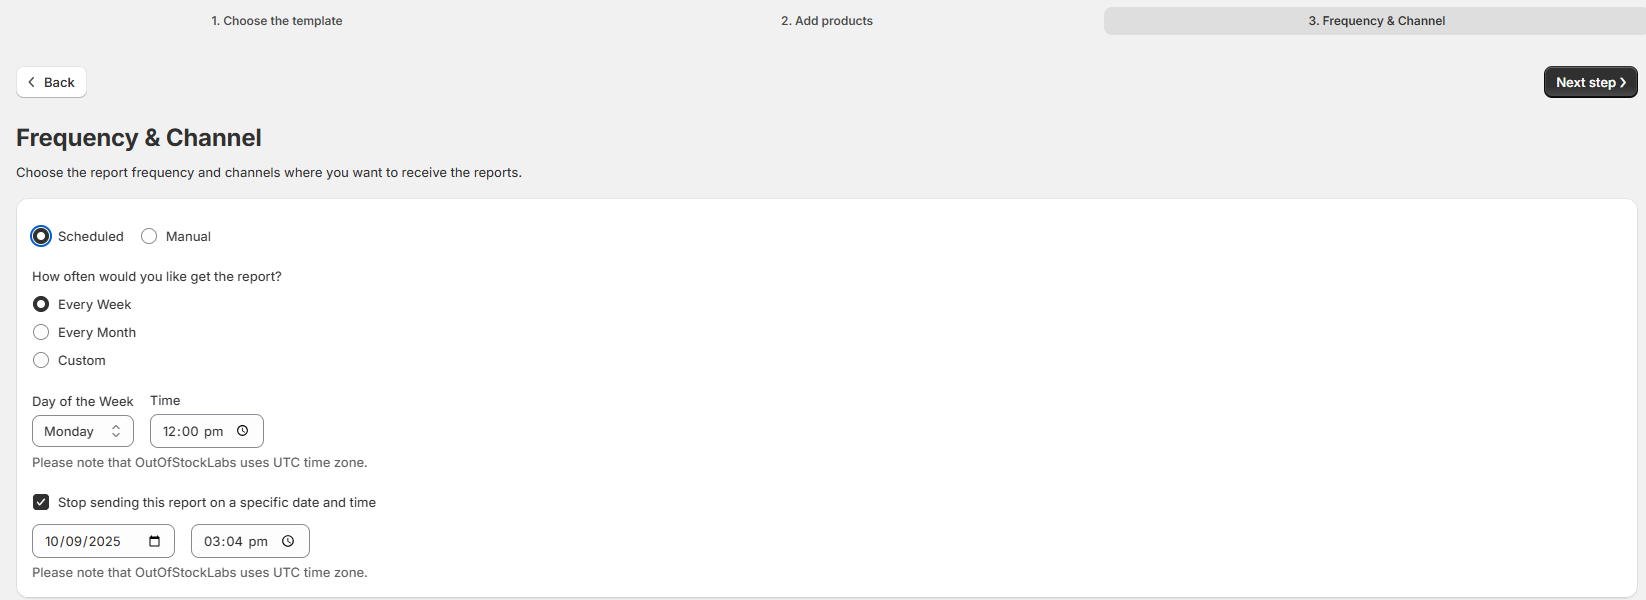
FREQUENCY AND CHANNEL
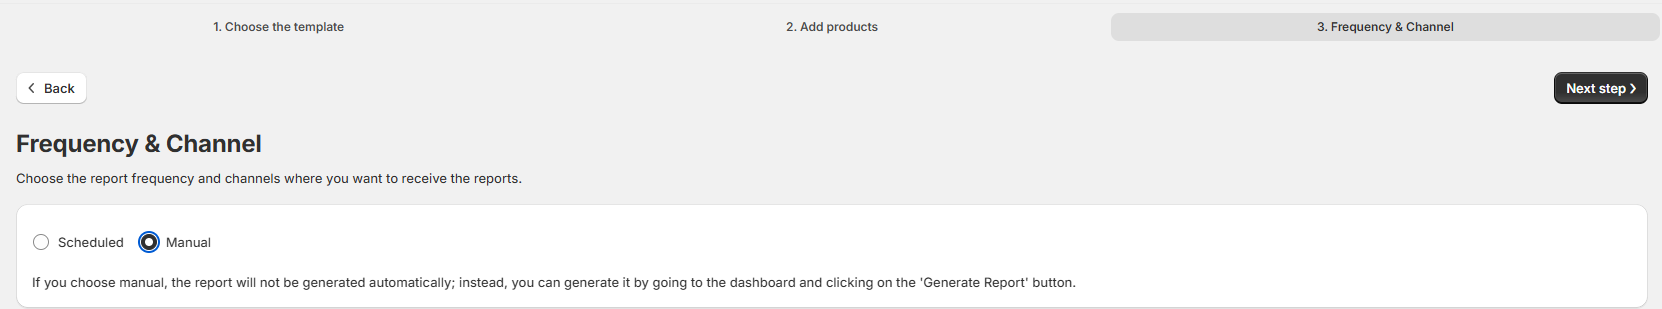
Step 7: Set up the Frequency and Channel
In this step, you will decide when reports are generated and how you receive them.
Choose the Report Generation Method
Manual – You must trigger the report yourself from the Dashboard by selecting the report and clicking Generate Report.
Scheduled – The system will automatically generate reports based on your chosen frequency (e.g., daily, weekly, monthly). You can also set an end date to stop report generation.
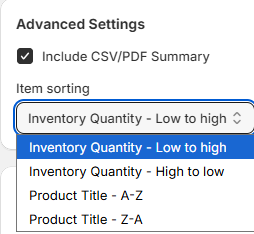
Configure Advanced Settings (Optional)
You can choose to include a CSV or PDF summary in the report notification sent via email.
Attachments can be automatically sorted by item, depending on your selected preferences.
Select Notification Channels
Choose how you want to receive the report: Email, Slack, or WhatsApp.
You can select a single channel or enable all three.
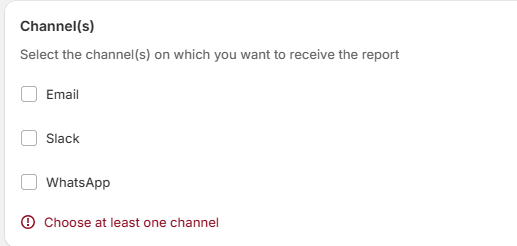
Once you’ve completed the setup, click Finish to save and activate your report schedule.
