OVERVIEW:
Sales Performance Increase shows how much your sales have improved (or dropped) over a period of time. It compares your current sales performance to a previous period so you can track growth and make informed decisions.
How Is It Calculated?
Sales Performance Increase is usually calculated using this simple formula:
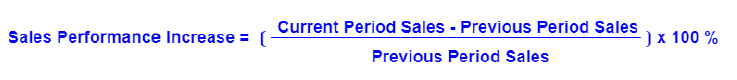
Let’s break it down:
Current Period Sales – The total units sold (or revenue earned) in the latest time period.
Previous Period Sales – The total units sold (or revenue) in the time period you’re comparing it to.
The result is shown as a percentage (%).
Example:
You sold 150 units this week, and you sold 100 units last week.
Sales Performance Increase = ((150 - 100) / 100) × 100 = 50%
This means your sales went up by 50% compared to last week.
If Sales Went Down:
Let’s say you sold 80 units this week and 100 units last week.
Sales Performance Increase = ((80 - 100) / 100) × 100 = -20%
A negative number means a decrease in performance. In this case, your sales dropped by 20%.
Why It Matters:
Tracking your sales performance increase helps you:
See what’s working in your store (e.g., promotions, new collections)
Spot slow periods and adjust your strategies
Understand overall sales trends over time
Things to Keep in Mind:
Make sure you compare the same time frames (e.g., week vs. previous week).
Large percentage changes can happen if your previous sales were very low.
You can compare sales performance by units sold or revenue, depending on your reporting settings.