
🧭 Understanding Your Dashboard
Your Dashboard serves as the central hub where you can easily monitor, manage, and access all your Reports and Alerts in one place. It gives you a clear overview of your active reports, their types, statuses, and when they were created — helping you stay organized and in control of your store’s performance.
📊 Dashboard Overview
The Dashboard is divided into two main sections:
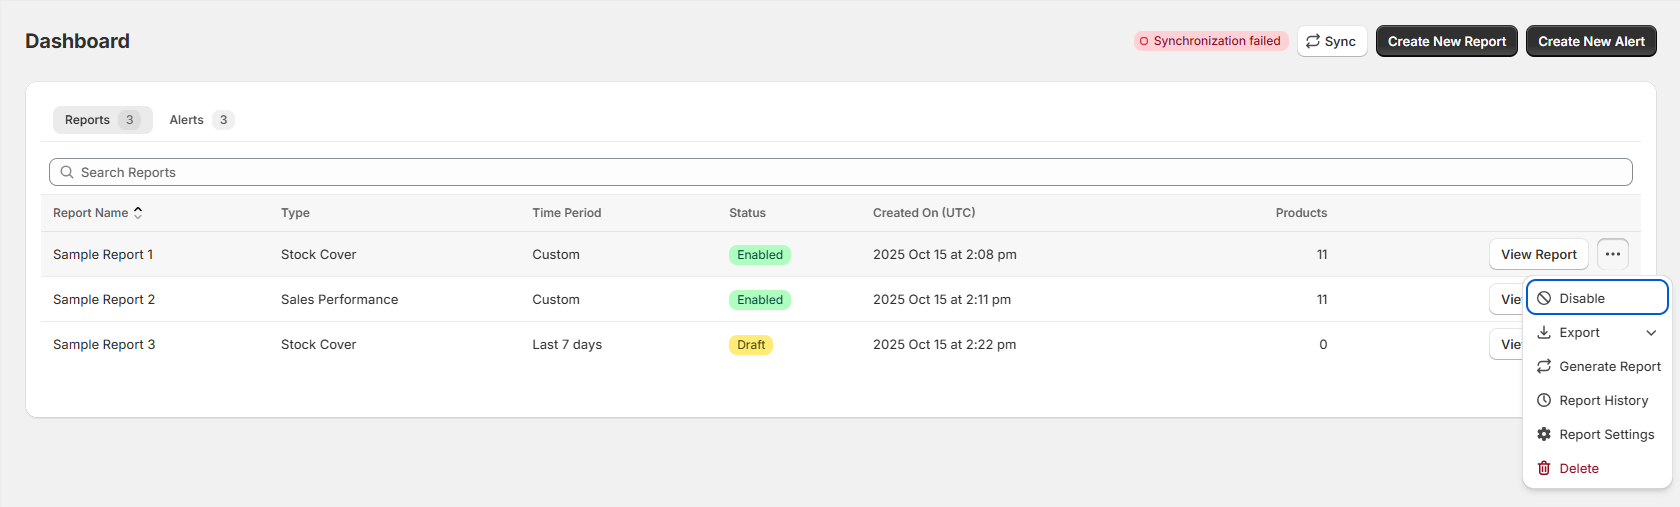
Reports Tab – Displays all reports you’ve created, such as Stock Cover Reports and Sales Performance Reports.
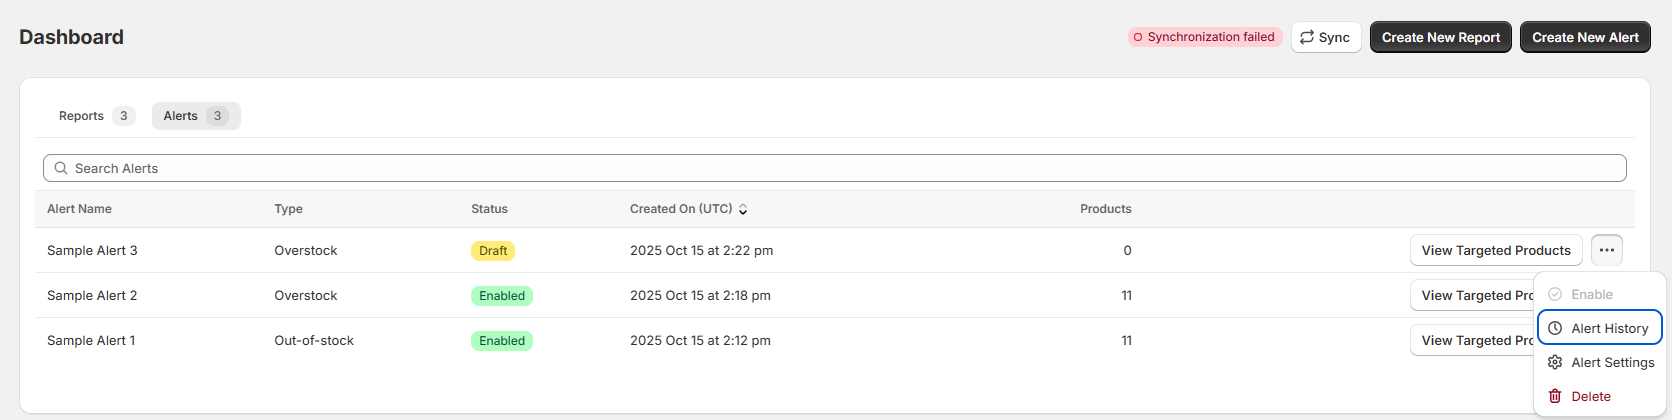
Alerts Tab – Shows your active and draft alerts, such as Out-of-Stock or Overstock alerts.
You can switch between these tabs anytime to quickly view and manage your data.
🔔 Creating and Syncing
At the top right, you’ll find action buttons:
Create New Report – Start building a new report from scratch.
Create New Alert – Set up alerts to monitor specific inventory or sales events.
Sync – Manually sync your data to ensure your reports and alerts are updated.
If synchronization fails, an error indicator (like “Synchronization Failed”) will appear, prompting you to retry syncing.
🔍 Reports Table Breakdown
Each report is listed in a table with the following key details:
Report Name – The name you assigned to your report.
Type – Indicates the kind of report (e.g., Stock Cover, Sales Performance).
Time Period – Shows the time frame used for the report’s calculation (e.g., Last 7 Days, Custom).
Status – Displays whether the report is Enabled, Draft, or Disabled.
Created On (UTC) – Shows the exact date and time the report was created.
Products – Indicates the number of products included in the report.
You can use the Search Bar to quickly find specific reports by name or type.
⚙️ Managing Reports
For each report, you have several available actions (accessible via the three-dot menu):
Disable – Temporarily turn off a report without deleting it.
Export – Download report data for external analysis.
Generate Report – Re-run the report to get the latest data.
Report History – Review previously generated results.
Report Settings – Edit or update the configuration of your report.
Delete – Permanently remove the report from your Dashboard.
You can also click View Report to open and review detailed insights for that report.
🔔 Alerts Table Breakdown
The Alerts tab lists all notifications you’ve set up to stay informed about important inventory events — such as out-of-stock, or overstock products. This section helps you monitor potential risks and respond before they impact your operations.
Here’s what you’ll see:
Alert Name – The title you assigned to the alert.
Type – The alert type (e.g., Out-of-Stock, Overstock).
Status – Whether the alert is Enabled or in Draft mode.
Created On (UTC) – The date and time the alert was created.
Products – The total number of products being monitored.
💡 Tip: Use the search bar to quickly locate alerts by name or type.
⚙️ Managing Alerts
Available Actions (⋯ menu):
Enable / Disable – Activate or pause an alert.
Alert History – View previous alert activities and triggers.
Alert Settings – Edit alert details or conditions.
Delete – Remove an alert permanently.
Click View Targeted Products to see which products are included in the alert’s monitoring list.
💡 Why the Dashboard Matters
The Dashboard helps you stay on top of everything that matters to your store — reports, insights, and alerts — all in one organized view. By combining visibility and control, it ensures you can make smarter, data-driven decisions and maintain a smooth inventory flow without missing any critical updates.